LLOYD DIAGRAMS
The following is the Lloyd Diagram presentation made at the 2012 ASQ World Conference in Anaheim, CA.
Simply click on the below link to either open the file or download it.
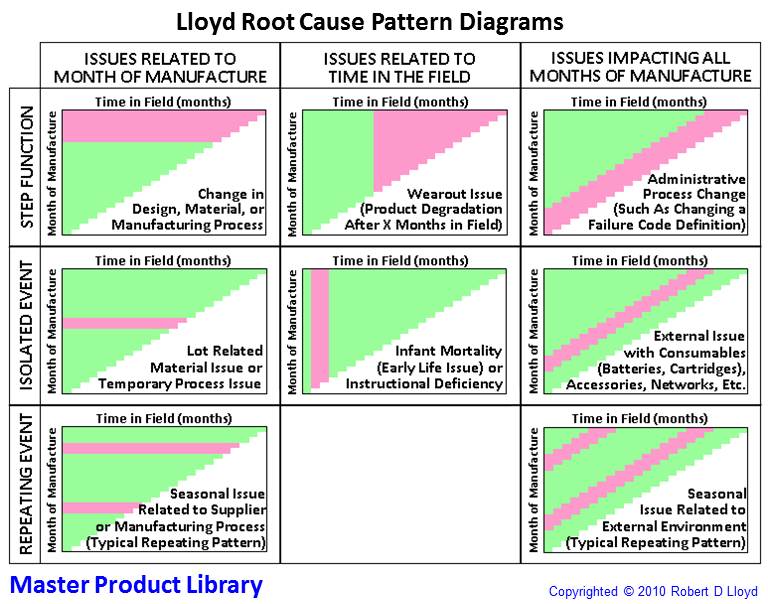
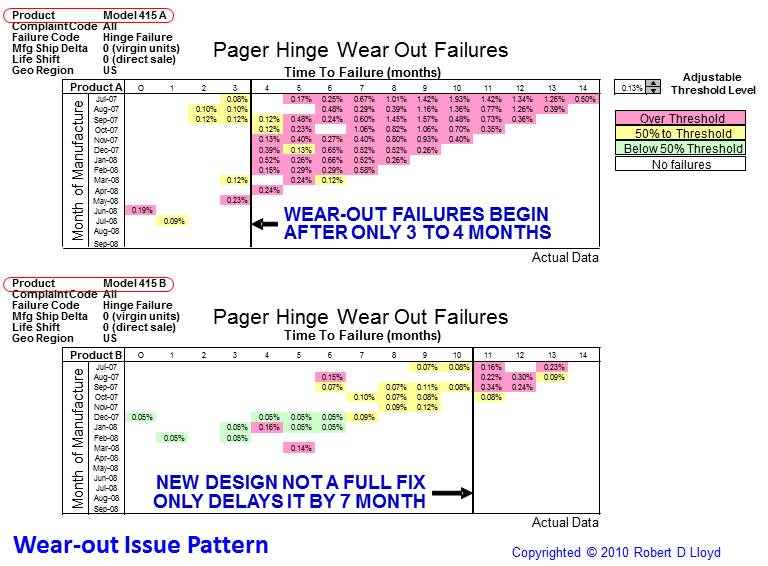
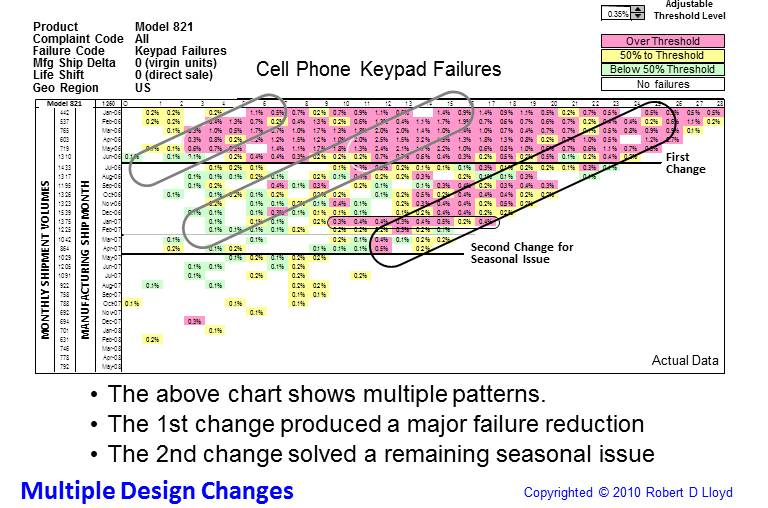
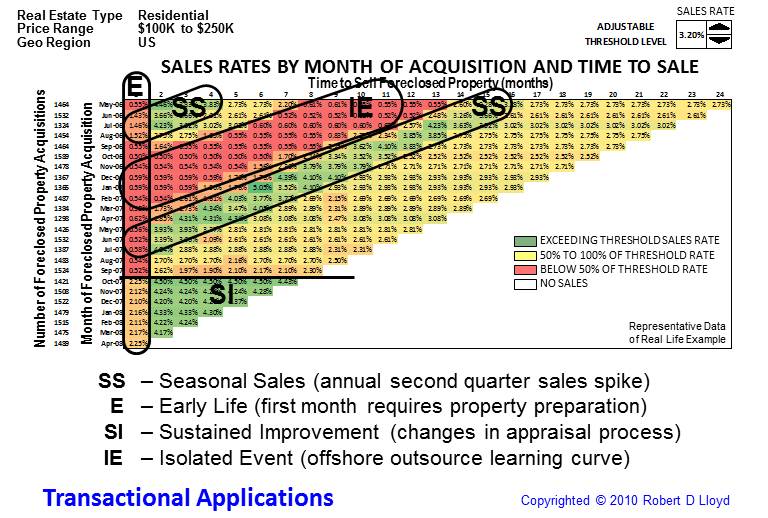
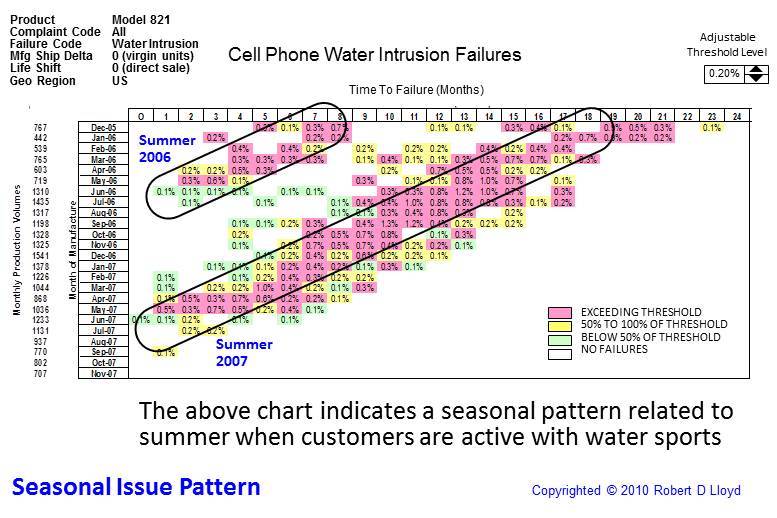
Lloyd Root Cause Pattern Diagrams are a data mining technique that takes complaint and/or failure codes for products in combination with their date of manufacture and time to failure in order to quickly plot graphical data patterns that indicate their root cause area. These diagrams can also be used for analyzing many transactional issues.
Based on Shainin principles that during product or service life that typical issues are random, we look for patterns in the data that indicate where problems are occuring. By filtering our data and conditionally formating the data cells to a master reference cell, we can sweep the data looking for patterns, much like how the sonar operator swept frequencies to find patterns in the sonar echos to find the Soviet submarine in the movie "The Hunt for Red October" .
A library of established data patterns help us to identify which issue we are experiencing. Although it may not necessarily pin-point the root cause, it will get you very close, similar to your tee shot landing on the green.In addition to this Master Product Library, there is also a library for identifying transactional issues. A transactional plot is shown at bottom right.
Lastly, Lloyd Diagrams are particularly useful in addressing ellusive No Defect Found (NDF) issues by using a failure-complaint cross-reference table, filtering, and searching for patterns with these diagrams.
