CONJOINT MARKET ANALYSIS - SAWTOOTH SOFTWARE
(UNDERSTANDING RELATIVE IMPORTANCE OF MARKET DRIVERS)
DIRECT QUESTIONING YIELDS POOR DATA
Asking subjects direct questions like the following are usually futile:
- How many minutes would you prefer in your monthly plan?
- How much would you like to pay for your monthly plan?
Of course the answers will likely be unlimited minutes for free.
Even if you ask your subjects to state relative importance, such as:
- How important are the number of minutes to you?
- How important is the price of the plan to you?
The answers will likely be "very important" for all questions. However, when ALL items are very importnat then NONE are really important.
CONJOINT MARKET ANALYSIS
With Conjoint Market Analysis, we can identify the subjects' true drivers by tapping their subconscious.
This is done by combining product features at different levels and offering these different combinations to the subject and forcing them to choose the best one from successive groups of 3 or to give each combination a relative score or rank.
The example (right) has 3 factors (Brand, Interest Rate, Credit Limit) that each have 3 different levels. By forcing the subject to choose, rate or rank, we can discover how their subconscious makes purchase decisions. The subject themself, might not even be aware of these preferences.
The result of this analysis provides plots of how the subject truly values the relative importance of the factors and levels. The steepness of the plot indicates the degree of importance and which value is preferred.
Responses are highly dependent on each subject's needs requirements. The results can be used to group similar responses to create market segments.
KANO ANALYSIS
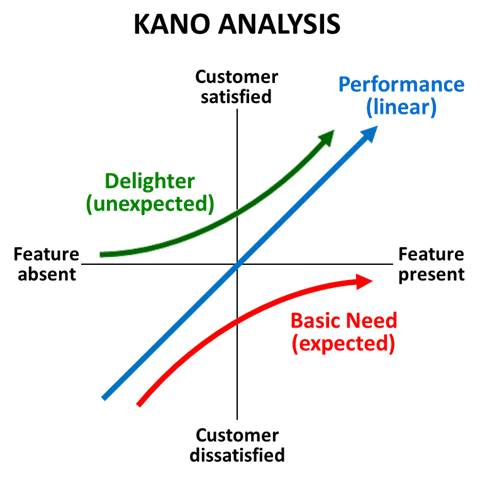
We use Kano Analysis to understand the relative importance that each customer places on the presence of certain features or criteria. The vertical axis denotes the degree of satisfaction the feature creates with respect to its degree of presence, shown on the horizontal axis. Thus, Kano helps in prioritizing the inclusion of features for specific markets.
The presence of Basic Needs will never delight customers because they are expected. However, their absence will cause severe displeasure. Having a bed in your room does not delight. Not having a bed is severe displeasure.
Delighters will cause a high degree of pleasure, but their absence will not cause displeasure, since they were not expected in the first place. Such an example would be free, recently released movies on an airline flight.
Performance Needs increase satisfaction as their presence increase. Examples of these are miles per gallon or internet download speed.
Over time delighters will become more and more expected until they become basic needs. This effect is called Needs Migration. An example is free high-speed internet in your hotel room. In 2000 it was a delighter, but in 2019 it is expected.
To conduct Kano Analysis, a specially constructed survey must be created with functional and dysfunctional questions and the subjects segmented.
ADVANCED MARKET RESEARCH
QUANTITATIVE ANALYSIS OF WHAT TRULY DRIVES MARKETS
QUANTITATIVE ANALYSIS OF WHAT TRULY DRIVES MARKETS


RANKING OF COMBINATION PREFERENCES
(9 = MOST PREFERRED, 1 = LEAST PREFERRED)
DRIVER ANALYSIS FOR MARKET SEGMENT THAT PAYS OFF CREDIT CARD BALANCE EACH MONTH